
STAT & STATE STAT & STATE Complexity, Clarified

India, measured in numbers.
Uncovered in stories.

Stat & State translates complex data on economics, climate shifts, and social transitions into readable, visual, and independent narratives. We uncover the truths hidden behind national aggregates.

THEMATIC PILLARS

Artificial Intelligence

Generative AI frontiers, computing scale, and digital sovereignty.

Explore Artificial Intelligence

Climate

Shifting monsoons, extreme rainfall variations, and adaptation analysis.

Explore Climate

Demography & Markets

Fertility paradigm transitions, demographic dividends, and regional labor.

Explore Demography & Markets

Economy

National output, growth metrics, inflation index, and geographic divides.

Explore Economy

Education

Access divides between urban and rural, facilities, and student-teacher ratios.

Explore Education

Health

Nutrition science, obesity epidemiology, metabolic health, and public health policy.

Explore Health
THE NUMBERS BEHIND THE NATION

Interactive Key Findings

12x PER CAPITA GDP AVERAGE
ECONOMY SUMMARY

$3.92 trillion GDP, 7.8% quarterly growth, and a 12x regional income gap.

India's economy has reached $3.92 trillion, growing at a robust 7.1% to 7.8% real rate under its new 2022-23 base series. However, this headline velocity masks deep structural divides. The high-productivity services sector contributes 55% of output but absorbs only 29% of workers, leaving 46% of the workforce underemployed in agriculture. Regionally, the per capita income gap between wealthy states like Goa (₹7.09 lakh) and poorer states like Bihar (₹59,056) stands at a massive 12x. To successfully leverage its demographic window, which peaks in the 2030s, India must accelerate low-skill manufacturing and create formal non-farm jobs.

Read GDP Dispatch
4,247 RISE IN EXTREME WEATHER EVENTS
CLIMATE SUMMARY

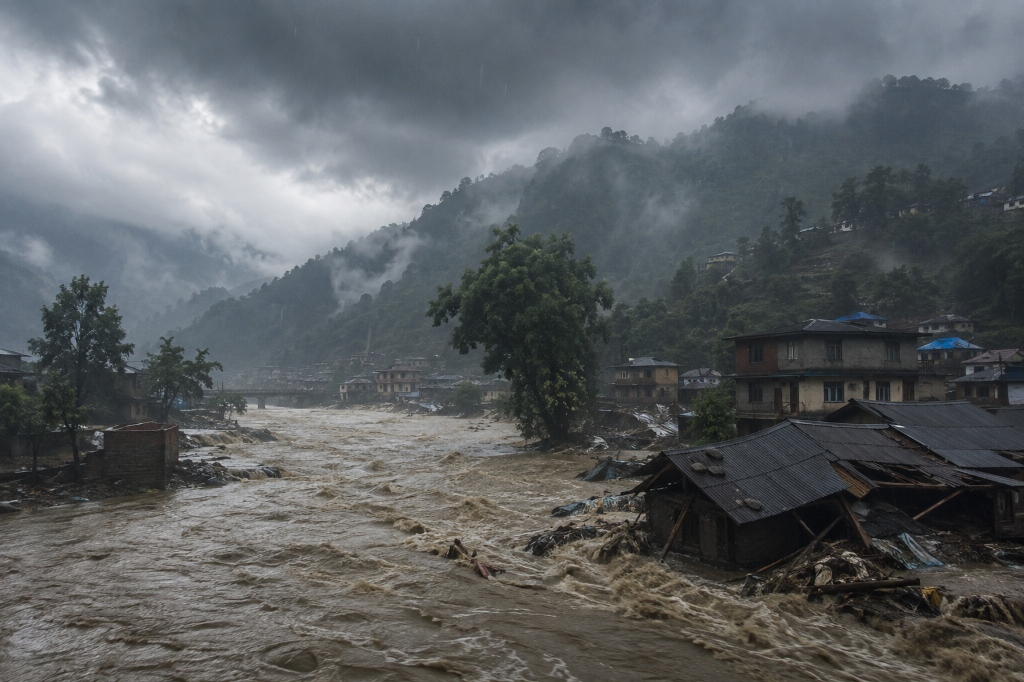
903 dead, 4,247 missing (NDRRMA, 31 Aug). The trigger was not an earthquake.

On 26 August 2026, a rock-slope and glacier collapse on Langtang Lirung generated a seismic signal initially logged as a magnitude 4.4-5.2 earthquake. It was not. More than 100 million cubic metres of ice, rock, and debris dropped into the Bhote Koshi river system, producing a surge that travelled at roughly 193 km/h over its first 22 km and devastated a 72-km corridor from the Nepal-Tibet border to the Trishuli. As of 31 August, NDRRMA reports 903 dead, 1,473 injured, and 4,247 missing. Those numbers are provisional.

Read Climate Dispatch
1:43 CRITICAL RURAL CLASSROOM RATIO
EDUCATION & SOCIETY SUMMARY

62% urban vs 24% rural school internet access. Only 48.8% rural Std V students can read a Std II text.

While school enrollment in India is near-universal at over 98%, student retention, digital infrastructure, and foundational learning show a deep rural-urban gap. A rural school is almost three times less likely to have internet access and twice as likely to lack functional computers compared to its urban counterpart. Post-pandemic learning loss has begun to recover, but the schooling divide remains a major barrier to social mobility.

Read Education Dispatch
LATEST DISPATCHES

Recent Investigative Stories

VIEW ALL DISPATCHES
The Mountain Broke: Inside the August 2026 Nepal-Tibet Floods Climate

The Mountain Broke: Inside the August 2026 Nepal-Tibet Floods

A rock-ice avalanche on Langtang Lirung sent more than 100 million cubic metres of debris into the Bhote Koshi river system on 26 August 2026. What followed is the deadliest cryosphere-driven disaster in Nepal's recorded history.

Beyond Chatbots: The Data-Driven Rise of Agentic AI Artificial Intelligence

Beyond Chatbots: The Data-Driven Rise of Agentic AI

In 1966, ELIZA could fake a therapy session using twenty lines of pattern-matching script. In 2026, an AI agent browses the web, executes code, fact-checks its own claims, and delivers a finished research brief without a human touching a keyboard. Here is the data behind the most compressed capability leap in technology history.

THE MANIFESTO

Complexity, Clarified.

Stat & State is an independent data journalism desk. We decode dense datasets on economics, environmental shifts, and demographics to reveal the structures shaping India's future. We do not tell you what to think; we present the evidence to plan, adapt, and lead.

OUR DATA METHODOLOGY
01

Decode

Isolating reliable signals from market noise and raw public datasets.

02

Analyse

Testing hypotheses against rigorous, multi-round statistical foundations.

03

Simplify

Translating dense indicators into intuitive, boardroom-ready dispatches.